Charts of the day: Creative destruction in the S&P500 index
January 30, 2014 Leave a comment
Wednesday, January 29, 2014
Charts of the day: Creative destruction in the S&P500 index
Mark J. Perry | January 26, 2014, 10:10 pm
 A 2012 article by Richard Foster (“Creative Destruction Whips through Corporate America“) provides a great example of “creative destruction” in the US economy and stock market – the accelerating turnover in the S&P500 Index based on almost 100 years of data. Here are some key findings:
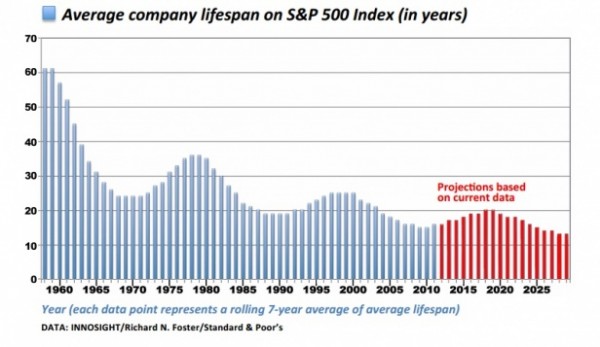
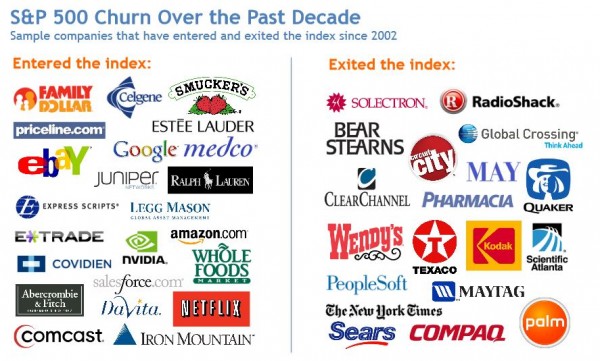
1. US corporations in the S&P500 in 1958 remained in the index for an average of 61 years. By 1980, the average tenure of an S&P500 firm was 25 years, and by 2011 that average shortened to 18 years based on seven year rolling averages. In other words, the churn rate of companies in the S&P500 has been accelerating over time (see top chart above, and examples of the S&P500 churn in the bottom chart).
2. On average, an S&P 500 company is now being replaced about once every two weeks.
3. At the current churn rate, 75% of the S&P 500 firms in 2011 will be replaced by new firms entering the S&P500 in 2027.
4. In 2011, a total of 23 companies were removed from the S&P500, either due to declines in market value (for instance, Radio Shack’s stock no longer qualified as of June) or through an acquisition (for instance, National Semiconductor was bought by Texas Instruments in September).
And here’s Foster’s conclusion:
As we head into a time of stronger growth coupled with increase technological change, the message for senior executives is clear: if you aim to maintain control of your corporation and deliver value to shareholders and customers, you must embrace creative destruction rather than wait to become a victim of this unstoppable force.

