A bull market without buyers
December 22, 2013 Leave a comment
| Dec 16 13:34 | 1 comment | Share
A particular kind of buyer, at any rate. Talk of corporate cash piles has become cliché, while private equity has been turning a corner for so long it has entered some sort of fee-paying mobius strip. But it remains the case that stock markets have gone up without many purchases of companies in their entirety.
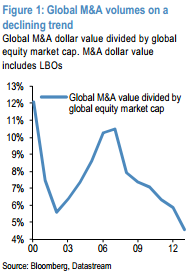
For illustration, the last decade of deal activity as a proportion of market capitalisation, from Nikolaos Panigirtzoglou and team at JP Morgan.
Meanwhile, the pace of buy backs has slowed, while equity issuance has soared – think about all the listings of former buyouts by private equity.
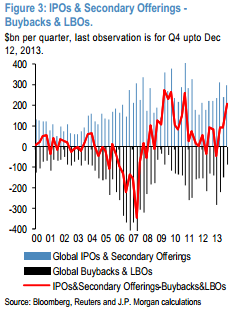
How high is net equity issuance currently? Figure 3 proxies net equity issuance by subtracting announced share buybacks and LBOs, which cause equity withdrawal, from total equity offerings, i.e. IPOs and secondary offerings, which increase the share count. Figure 3 shows that equity issuance turned a lot less supportive for equity markets (i.e. red line increased) in Q4 relative to previous quarters and in 2013 as a whole vs. 2012. We note this is both because of a slowing in announced share buybacks but also an increase in IPO/secondary offering activity.
This behavior is rather unusual, as typically net equity issuance tends to decline during bull equity markets and become very negative. This is because during bull equity markets corporates tend to chase momentum by boosting M&A, LBO and share buyback activity by more than equity offerings, thus amplifying the equity rally, even that eventually meant that they bought equities at the peak. This is shown clearly in Figure 3 where the red line was deeply negative in 2006/2007 at the peak of the previous equity cycle, but it is unusually positive in the current equity cycle. In fact, the Q4 level of our proxy for net equity issuance is close to the peak seen during 2009 after the Lehman crisis. In a way, corporates preferred to “sell” equities to equity investors this year, rather than joining them and amplifying the rally.
So what’s happening? Well, there is the Federal Reserve, et al, and the effect of quantitative easing. But that explains the rising market without getting at the absence of corporate activity.
JPM have a couple of theories. One is that while private equity is awash in dry powder (perhaps $800bn worth) the industry is still working through the backlog of$2tn in unsold assets which were acquired in the boom days.
Another is uncertainty. Idiots have taken over the US asylum, there is theSchrödinger’s cat problem of the end to massive monetary stimulus, and US business is still holding out for a repatriation break for cash earned on products designed in America but taxed in Ireland.
But another novel factor JPM would throw in is that the equity risk premium has fallen.
The decline in the equity risk premium relative to bonds is, by itself, making it less attractive for corporates to purchase their equity by issuing debt. Our proxy of the S&P500 equity risk premium (ERP) has declined from a peak of 6.9% in the summer of 2012 to 4.8% currently, as a result of the rally in equities and the rise in bond yields.
The logic here is that that taking companies private/consolidation is a form of equity withdrawal. Go to the note for the full explanation of the maths, but broadly the JPM team estimate net debt versus net equity issuance for US non-financial companies using flow of funds data (which captures actual, rather than announced buy-backs, apparently).
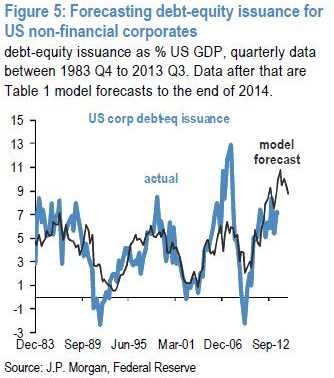
Using quarterly US Flow of Funds data on corporate debt and equity issuance (the latter is typically negative due to buybacks) since 1983, we find that corporate debt minus equity issuance as % of GDP is well explained by past default rates of high-yield companies, the equity risk premium, and cash flows (as % of GDP).
What it produces is this chart:
Which gives the possibility of using to to clear some of the fog in the crystal ball. But, as ever, the future is a confusing place.
The model can be used for forecasting as we find that the three drivers affect leverage with a clear time lag. Using the recent experience of the three drivers –– low default rates, high equity risk premium, and high profit margins –– it should not be a surprise that it projects that US companies will issue a lot more debt than equities over the coming two years. The model projects that US debt versus equity issuance will rise from a current 7% of US GDP pace to around 9% by the end of next year. Although there is further upside in debt – equity issuance activity according to this model, this is less than a year ago when the model was projecting that US debt versus equity issuance will rise to more than 11% of US GDP.
We think we’re in the realm of explanation without reassurance here. What was that about keeping one foot out the door?

