Bond Bubble, Or Rational Expectations? Visualizing 220 Years Of Treasury Yields
April 24, 2013 Leave a comment
Bond Bubble, Or Rational Expectations? Visualizing 220 Years Of Treasury Yields
Tyler Durden on 04/23/2013 22:09 -0400
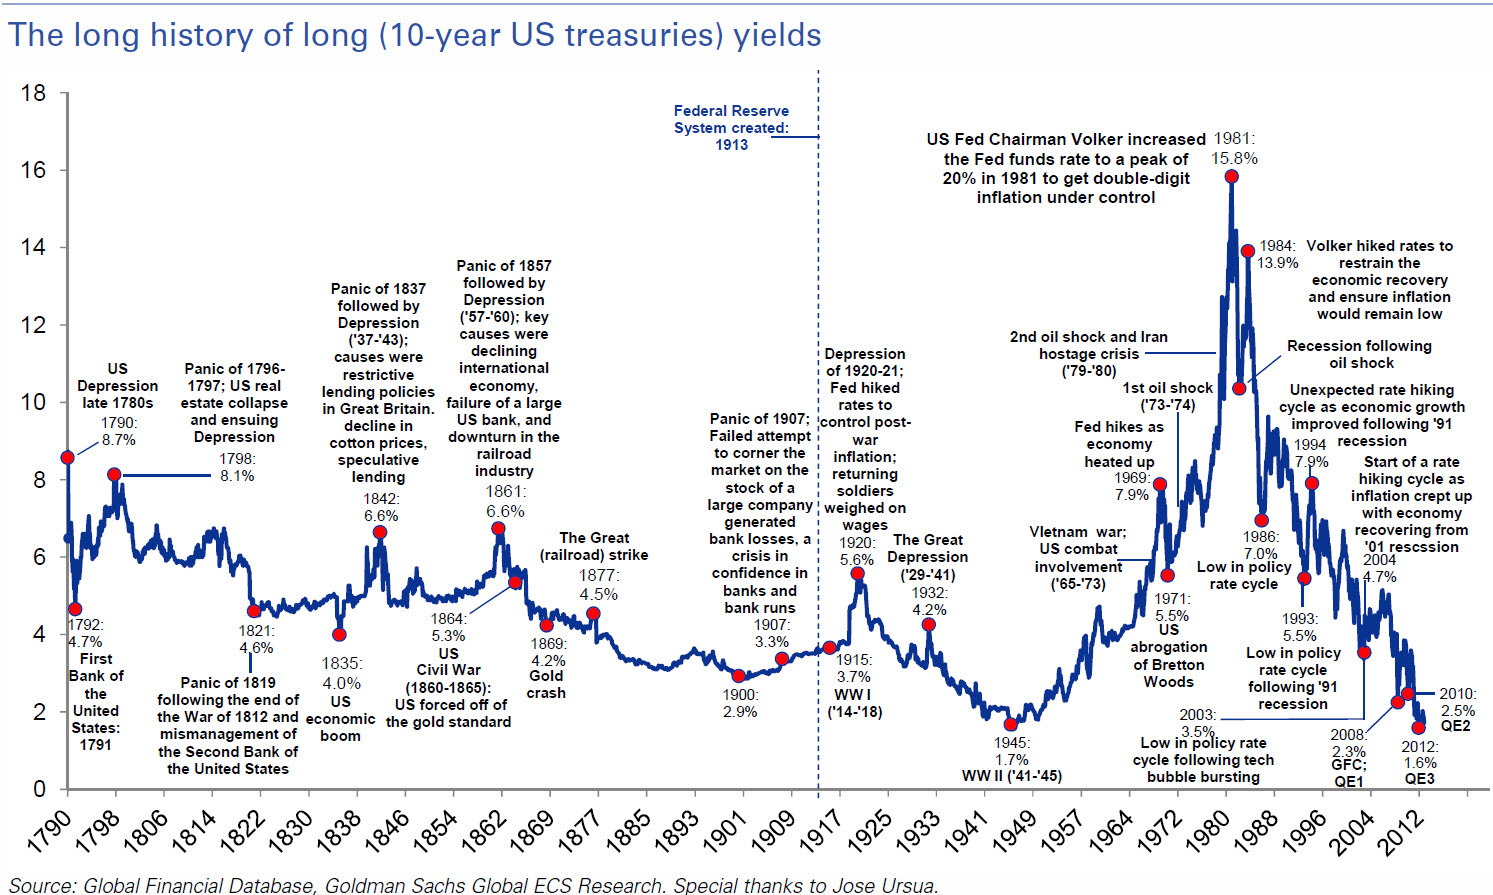
Near multi-generational low bond yields, driven at least in part (and some think in full) by the undeniably large asset purchase program (Quantitative Easing (QE)) that the US Federal Reserve has been implementing in one form or another since the 2008 Global Financial Crisis (GFC), have pushed the question of whether or not the bond market is a bubble to the front of many people’s minds. However, while the chart below of over 220 years of 10-year treasury yields shows the extraordinarily low bonds yields, they have resulted from many fundamental and rational drivers (expectations of weak economic growth and safe haven flows amid the European sovereign debt crisis) in addition to Fed purchases. So while bond prices look expensive, there is nothing particularly bubbly about the bond market today.