Presenting The Full Impact Of Stock Buybacks On S&P 500 “Earnings”
May 29, 2013 Leave a comment
Presenting The Full Impact Of Stock Buybacks On S&P 500 “Earnings”
Tyler Durden on 05/28/2013 14:23 -0400
There has been much speculation in the recent past over what the bottom-line impact of surging stock buyback activity has been on the overall S&P earnings: after all, by removing shares from circulation, the denominator in “per share” calculation gets smaller and smaller with every incremental buyback. Courtesy of JPM we finally have a definitive answer to this long-running question. Of the change in S&P TTM operating earnings between Q3 2011 and the just completed Q1 2013, a stunning 60% or $2.20, of all “gains” of $3.70 have been the result of buybacks. The remainder: a tiny $1.50 is due to actual organic growth. This means that nearly 60% of the bridge between the LTM operating earnings of $94.60 as of Q3 2011 to $98.30 at Q1 2013 has come from corporate management teams engaging in shareholder friendly activity.


 JPM has more:
[A] way of measuring equity withdrawal is via the share count of major equity index which roughly speaking is equal to the market value of the index divided by the price of the index. Divisor changes reflect changes in outstanding shares due to share buybacks or other corporate actions such as the ones mentioned above. But they also reflect addition or deletion of stocks to the index. If the S&P 500 closes at 1650 and one stock is replaced by another, after the market close, the index should open at 1650 the next morning if all of the opening prices are the same as the previous day’s closing prices. This is achieved with an adjustment to the divisor.
The Divisor of the S&P500 Index is shown in Figure 5. This Divisor experienced a massive increase in the 1990s but started falling in 2004 due to strong buyback activity. Between 2004 and 2008 it fell by 7% or almost 2% per annual decline pace. It rose after Lehman due to large share issuance especially by financials and a drying up of share buyback activity. It started declining again in 2011 as share buybacks picked up. Since September 2011 the S&P500 Index Divisor is down by more than 2%.
The fall in the S&P500 Index Divisor has helped the earnings picture in the US. Had the Divisor remained constant since Q3 2011, the 4-quarter rolling S&P500 Operating Earnings-Per-Share would have only risen by $1.50 instead of the reported $3.70 increase. The S&P500 Operating EPS has risen from $94.60 in Q3 2011 to $98.30 in Q1 2013. Indeed studies have found that managers tend to increase share buybacks in periods of slow earnings growth to boost EPS via shrinking the denominator, i.e. the number of shares.
It gets worse: recall from “Where The Levered Corporate “Cash On The Sidelines” Is Truly Going” that the bulk of the latest credit bubble frenzy is going not to finance actual organic growth, but merely to fund buybacks (see Apple), in an ongoing capital structure (cheap debt, rich equity) arbitrage. As Albert Edwards put it back then: “When the next leg in the “structural bear market” occurs, expect the equity buybacks to end, contributing to a renewed steep downturn in bank borrowing and monetary aggregates. The recent surge in the money data should be seen as a sign of the ills in the US economy, not health!”
While we will not comment on the timing aspects of such buyback surges, this is precisely what JPM has found as well:
But this is not the only distortion share buybacks create. Share buybacks mask weak credit growth in the economy. And this is especially true for the US as 80% of global share buybacks are typically announced by US companies. And these share buybacks are typically financed by debt issuance as even those US companies with large cash holdings appear to be reluctant to repatriate their cash holdings and instead prefer to issue debt to fund share purchases.
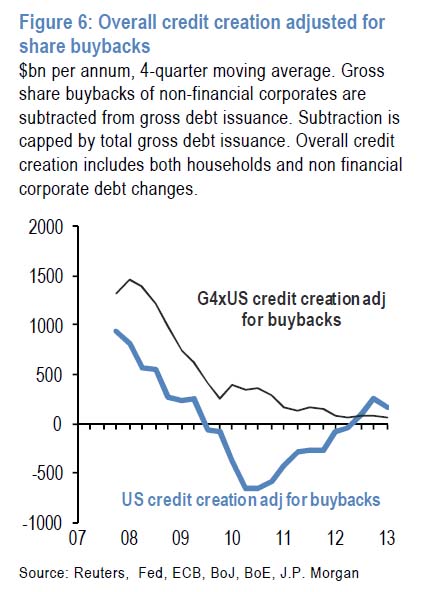
We have highlighted in the past that US credit growth is tracking a pace that is significantly better than the rest of the G4, i.e. Euro area, UK and Japan. This is not true though if one removes the impact of share buybacks. Figure 6 shows total credit creation i.e. the growth of both household and non financial corporate debt adjusted for share buybacks. In particular at each quarter we subtract the announced share buybacks from gross debt issuance of non financial corporates. Subtraction is capped by total gross debt issuance in each quarter. Figure 6 shows the credit creation in the US and in the G4 x US over time adjusted for share buybacks. US credit creation suffered by more than the rest of the G4 post Lehman due to intense US deleveraging at the time, but it has been rebounding since 2010. But the level of credit creation excluding share buybacks is not significantly better in the US than in the rest of the G4. The 4-quarter rolling sum of total credit creation was $160bn in the US at the end of the first quarter vs. $60bn in the rest of the G4. So the pace of credit creation is only modestly above zero in both the US and the rest of the G4 and well below 2007 peaks. In 2007 the annual pace of total credit creation exceeded $1tr in both the US and the rest of the G4 (excluding share buybacks).
To summarize: the only real credit creation, excluding the Fed of course, in the US in the past several years has gone to fund what is a slow-burning levered buyout by companies of their own share!
Curious why there is a sense that this no real corporate growth in the US? Because companies are simply not investing in growth, and are instead all engaging in cheap balance sheet arbitrage which makes corporate equities appear richer. The problem is that the debt remains, and once rates finally do go up…
Still feel like bashing corporations for being “stingy” with their cash? Just wait until all of these companies pull a Dole Foods from this morning and realize that the much neglected CapEx spending is far more important for long-term viability, and cut buybacks, and credit creation, to a halt. What happens to the S&P “operating earnings” growth then? JPM hints at precisely this theme we have discussed extensively in the past two years: “The other side effect of elevated dividends and share buybacks is that these distributions to shareholders may reduce the long term potential of the company to grow relative to the alternative of capital spending.”
Of course, in the long-term we are all dead so why even bother…

