JOLTS Jolts Jobs Report Cheerleaders, Implies Worst Job Growth Since September 2010
Tyler Durden on 05/07/2013 12:49 -0400
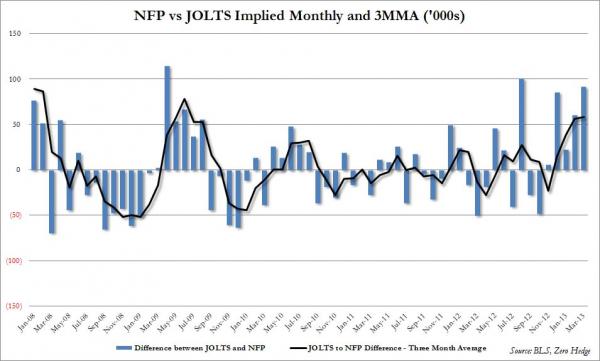
In the aftermath of last week’s decidedly weak unemployment report (pre-spun to appear strong while ignoring the major drop in average weekly hours worked, which would have resulted in a massive drop in payrolls had total demand for labor stayed constant from March), many were looking for some confirmation, or denial, from today’s Job Openings and Labor Turnover (JOLTS) survey which provides the labor breakdown by new job openings, hires, separations, quits and layoffs for the preceding month. On the surface, the March JOLTS survey was a disappointment – analysts look at the report to see how the Job Openings trend is doing as an indication of labor demand (a decline from 3.899MM to 3.844MM, and down from a year ago, or 3.848MM, as well). More importantly, New Hired tumbled to the lowest since December, printing at 4.259MM, down from 4.451MM in February, and down from 4.435MM a year earlier. On the exit side, workers indicates less leverage as well, with voluntary Quits, or worker-initiated departures, down 126K from 2.286MM to 2.160MM, while involuntary discharges, or terminations, spiked by 121K from 1.572MM to 1.693MM. As Stone McCarthy explains, this “hints at a less favorable environment for the labor market, especially when the increase in the number of layoffs (+121,000) is taken into consideration.” However, the biggest surprise from the JOLTS report is not in any of the standalone series, but in the time progression of the Net Turnovers number, which is simply the total new hires less total separations. Historically, the Net Turnover number tracks the total monthly nonfarm payroll change (establishment survey) on a almost tick for tick basis. Not this time. In fact as the chart below showed, the upward revised March NFP number to 138K, which preceded the even more optimistic, and much cheered April print of 165K, which sent the S&P and the DJIA soaring to new all time highs on Friday, not only did not get a confirmation, but in fact the JOLTS survey for Net Turnovers – which came at only 46K in March compared to a revised 138K jobs added per the establishment survey – implied that the real NFP number in March should have tumbled to a level last seen in September of 2010! Looking at only the difference between the monthly NFP change and the implied JOLTS monthly job change, we find only the third highest discrepancy since the Great financial crisis, as can be expected implying a far greater bullish upside bias reported by the BLS in the non-farm payroll data. In fact, on a three monthly moving average, the “bullish bias” difference to NFP reported data is now only as big as it was just after the Lehman failure! Of course, this data only looks back through March. It is quite possible that the April JOLTS data will be so strong, that it overwhelms the time series on both a monthly, and a moving average basis, promptly catches up to where it should be… Somewhere 150K higher than what the April payroll print of +165K suggested. Somehow, we doubt it.

 Read more of this post