Of 15 popular measures of equity valuation, CAPE (which compares share prices to a 10-year moving average of real earnings) was the only one that made stocks look expensive
August 16, 2013 Leave a comment
The CAPE of Less Hope
August 13, 2013 6:31 pmby John Authers
Cyclically-adjusted price/earnings multiples (CAPEs), as made famous by Yale’s Professor Robert Shiller, are growing inconvenient for the brokerage community. Last week, BofA Merrill Lynch’s Savita Subramanian pointed out that of 15 popular measures of equity valuation, CAPE (which compares share prices to a 10-year moving average of real earnings) was the only one that made stocks look expensive. The list of valuations suggesting US stocks are either cheap or at fair value includes:
trailing p/e
forward consensus p/e
trailing normalised p/e
price/book
enterprise value/ebitda
forward PEG (p/e ratio divided by growth)
trailing PEG
price/operating cash flow
price/free cash flow
enterprise value/sales
market-based equity risk premium
normalised equity risk premium
S&P 500 in WTI oil terms
and S&P 500 in gold terms
CAPE is thus beginning to stick out like a sore thumb. As it has been showing that stocks are expensive throughout most of the current rally, there is now a widening attempt to discredit or ignore it. Merrill’s own complaint is typical:
The Shiller P/E, which is based on inflation-adjusted earnings over the past 10 years, currently suggests that stocks are overvalued. However, this metric
assumes that the normalized (cyclically-adjusted) EPS for the S&P 500 is today less than $70—well below even our recessionary scenario for EPS. The
methodology assumes that the last 10 years is a representative sample, but the most recent profits recession was the worst we have seen and was exacerbated by a high leverage ratio which has since been dramatically reduced. Assuming that this scenario is going to repeat itself is, we think, overly pessimistic
But is it? Earnings volatility has certainly been extreme over the last decade, and arguably unprecedented. But if anything that suggests that the measure – which grew famous from efforts to predict the bursting of the dotcom bubble in 2000 and to show that the 2003-07 bull market was a “fools rally” – is more, not less, useful. That is the contention of Prof Shiller himself, and it is a reasonable one. More on this, with charts, and some comments from Prof Shiller, after the break.
It is true that real earnings, as measured by Prof Shiller, fell sharply. According to his own measure, they fell in the 21 months from June 2007 by 86 per cent. This was the greatest fall over such a short period in all his data back to 1871. But that precipitous fall in profits only tells half the story. Here is the 21-month change in real earnings, from 1871 to the present:
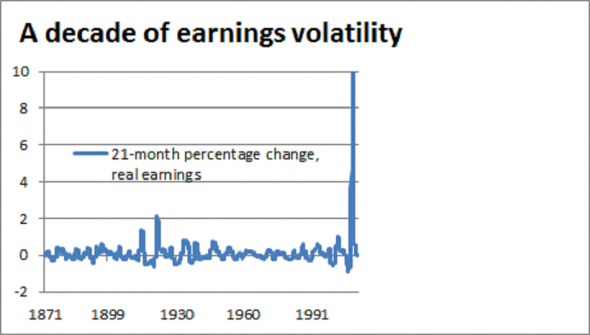
By squinting, you can see how bad the fall was. The problem is that the remarkable bounce back dwarfs it. There has been exceptional volatility over the last decade, but it has been in both directions (which is itself an argument for smoothing things out).
If we look at the moving average of 10-year earnings, taken from the Shiller website, we can see that the last decade no longer looks exceptional, or even particularly unusual (this is earnings per share in dollars, on a log scale):

Yes, it was the worst dip in earnings for a while, but there have been similar such incidents in the past, virtually all of which have been followed by bouncebacks on much the same scale.
There is thus no great reason to think CAPE will work worse in future than it has in the past. Here, then, is the signal it is now sending, using another chart from theShiller website:
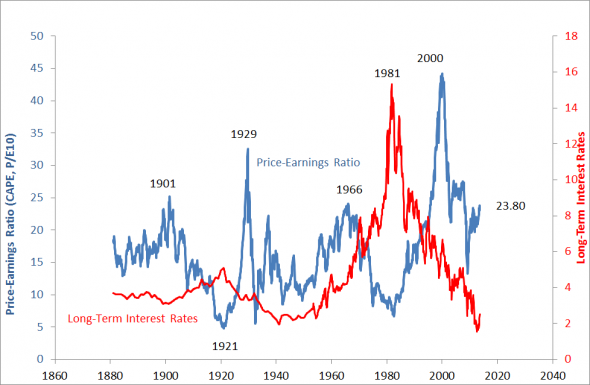
At 23.8, the Shiller CAPE suggests that stocks are clearly overvalued. But it does not suggest that they are a screaming sell or in a bubble, as it plainly did in 1929 or 2000, or that there is as much reason for concern as there was in 2007. Prof Shiller himself suggests that CAPE at this level is consistent with average real returns over the next decade of about 3 per cent – which is historically underwhelming, but would be grabbed with both hands by bond investors facing real returns not far above zero.
Why, then, does CAPE stick out so much from other measures of valuation? Prof Shiller told me:
It diverges so much because earnings have shot up. The sense is that they are unsustainable. They grew at about 2 per cent per year over the last 150 years. When they suddenly shoot up, in the middle of a financial crisis, you wonder. One thought is that companies are doing cost-cutting in reaction to the crisis, but that’s a short-term strategy that could backfire later. If you fire people who were doing something, you may discover that they were doing something important, eventually.
Other concerns have been raised against CAPE. Plainly it does not help in short-term timing, and there is something arbitrary about the ten-year period. But one year is also an arbitrary period, and Prof Shiller again has a defence.
I’m a behavioral finance type, and I understand that people make all kinds of investing errors. In a purely public spirit I want to make it simple and easy. Ten years is very simple. I would have preferred to make it an exponentially weighted moving average but we tried that and it didn’t seem to make any difference. You also have something that’s easy to explain.
No indicator, of course, is perfect. But CAPE’s value, to some extent, lies in its simplicity. It would be dangerous to ignore it, even if it would also be convenient to do so.

