Price-to-Earnings Ratios Aren’t Always What They Seem; P/E Calculations Based on Differing Views of Earnings Paint Competing Pictures of the Market
August 18, 2013 Leave a comment
BY MARK HULBERT
Price-to-Earnings Ratios Aren’t Always What They Seem
P/E Calculations Based on Differing Views of Earnings Paint Competing Pictures of the Market
MARK HULBERT
“The stock market is overvalued.” “The stock market is undervalued.”
Which one of these statements is true?
Both are, thanks to quirks of the most popular way of measuring a stock’s valuation: the price/earnings ratio.
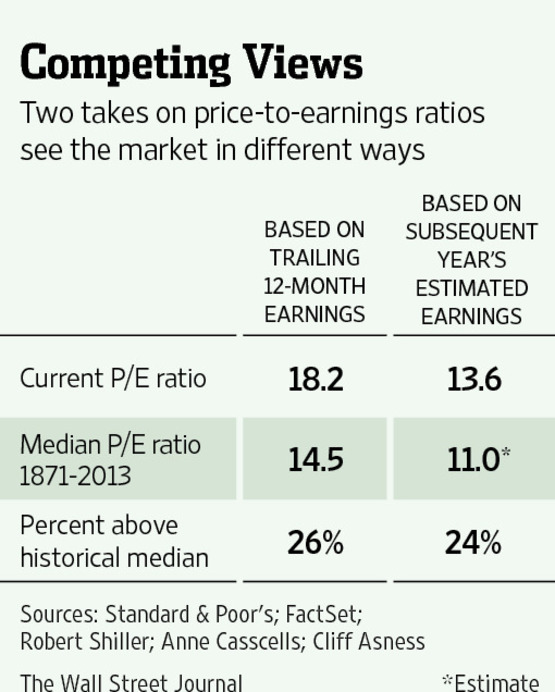
While no one disagrees about what the “P” is when calculating the ratio, there is no consensus on how to define earnings-per-share. One of the biggest points of dispute: whether to use analysts’ earnings estimates for the coming year or reported company earnings from the previous 12 months. Comparing ratios calculated in these two ways is little better than comparing apples to oranges, according to Cliff Asness, managing partner at AQR Capital Management, an investment firm with $84 billion of assets under management. In an email, he went so far as to say that those who compare P/Es in this way are engaging in a “sleight of hand,” though he allowed that many may “not be aware of the mistake they are making.”Consider the S&P 500’s current P/E based on trailing earnings. For the four quarters through June 30, the index’s earnings per share amounted to $91.13, according to S&P Dow Jones Indices. That translates into a P/E ratio of 18.2, which is higher than 79% of comparable readings since 1871, according to a database maintained by Yale University professor Robert Shiller.
Many bulls try to wriggle out from this bearish sign by focusing on estimated earnings.
According to FactSet Data Systems, the consensus forecast from Wall Street analysts is that earnings from companies in the S&P 500 will be $122.01 a share next year, which translates into a P/E ratio of 13.6. That is 6% less than the 14.5 median of historical P/Es in Mr. Shiller’s database.
There is a catch: Forward-looking P/Es are almost always lower than those based on trailing earnings—often much lower. There are at least three reasons why, says Anne Casscells, a managing partner at Aetos Capital, which runs several hedge funds. First, corporate earnings usually rise from one year to the next. In addition, analysts’ estimates focus on what’s known as “operating earnings,” a looser category than the actual reported earnings used to calculate the average of past P/Es.
And last but not least: Wall Street analysts’ predictions tend to be way too optimistic.
These three factors conspire to make forward-looking P/Es 24% lower on average than those based on trailing earnings, according to a study by Mr. Asness and Ms. Casscells into the two types of P/Es from 1976 to 2003.
Assuming this difference persisted over the entire 140 years in the Shiller database, the median forward-looking P/E has been just 11. The S&P 500’s current forward-looking P/E of 13.6 is therefore 24% above the median—not 6% lower.
The stock market doesn’t have to fall just because its P/E is above historical norms, of course. Ms. Casscells points out that the P/E ratio, like other valuation measures, exerts only a weak gravitational pull on the stock market’s near-term direction. And it is always possible that “this time will be different,” she says.
Still, a proper apples-to-apples comparison negates the bulls’ argument that the current market is cheap, she contends.
The investment implication is that one might focus on ways to gradually reduce equity exposure rather than increase it. When you sell any of your shares, for example, don’t automatically reinvest the proceeds from those sales in other stocks.
A related implication is that you should begin to shift toward more conservative holdings the portion of your stock portfolio you intend to hold through thick and thin. This means favoring companies with a larger stock-market value, little or no debt, a track record of consistently rising earnings and that hopefully pay a handsome dividend.
Examples are Johnson & Johnson JNJ -0.20% and Pfizer, PFE -1.49% both of which are at the top of the most-recommended stock list among those advisers beating the market over the past 15 years, according to the Hulbert Financial Digest.
The two companies have much lower debt loads than the average S&P 500 company and relatively high dividends. Johnson & Johnson and Pfizer sport dividend yields of 2.9% and 3.3%, respectively, calculated by dividing the annualized equivalent of each firm’s most recent dividend by its current stock price.
One mutual fund that invests in similarly tried-and-true companies is the Vanguard Dividend Growth fund. It also is at the top of the list of most recommended mutual funds among the 15-year market beaters. The mutual fund has an expense ratio of 0.29%, or $29 for every $10,000 invested.
Another fund that invests in similar stocks and is popular among the 15-year market beaters is the Vanguard Wellington Fund, with a 0.25% expense ratio.
August 16, 2013 4:14 pm
Cape may still be the best measure of market froth
By John Authers
Cyclically adjusted price/earnings ratio says stocks are expensive
How can we tell if stocks are too expensive? It is arguably the hardest question for long-term investors, but in recent years it had appeared that there was an answer. As regular readers will know, the cyclically adjusted price/earnings ratio (Cape) signalled the biggest market turning points over the last century, and also correctly showed that the rally after the 2000 dotcom crash was not to be trusted (it ended in the great financial crisis). This measure compares prices with the average of earnings for the previous decade, smoothing out any manipulation of earnings, and accounting for the tendency of p/e ratios to shift according to the profit cycle. Cape has two problems, however. One is that it has twice in the last decade failed to tell investors that stocks were cheap, ahead of rallies that lasted four years, in which stocks more than doubled. For fund managers and investors, this shakes their confidence. Cape might be right that stocks are historically expensive, they say, but you would still be better off buying them.
A second problem is that it currently suggests stocks are expensive – even though many shorter-term metrics suggest they are cheap. According to Yale University’s Robert Shiller, who popularised the measure, US stocks now sell for 23.8 times their 10-year earnings, compared with a long-term average of 16.5. This implies that returns for the next decade will be far below average. That is inconvenient for the big industry that is based on selling people stocks.
As a result, there is a concerted attempt to prove that Cape cannot be trusted. This might lead to useful fine-tuning of an important measure. But it could also delude investors into ignoring an important signal that stocks are overvalued.
Recently, Merrill Lynch’s Savita Subramanian produced a note looking at 16 different measures of the US stock market. All bar Cape suggested that stocks were either cheap or fair value. She said: “The most recent profits recession was the worst we have seen and was exacerbated by a high leverage ratio which has since been dramatically reduced. Assuming that this scenario is going to repeat itself is, we think, overly pessimistic.”
By Professor Shiller’s own data, which take into account inflation, the 92 per cent fall in real earnings over the 21 months from June 2007 was indeed the greatest fall over such a short period in US history.
However, earnings then enjoyed an equally historic rebound. From their nadir in March 2009 they rose twelvefold over the next three years.
How comparable are earnings over huge sweeps of history? The companies in the index change over time, as do accounting conventions, and tax. In 1900, US corporation tax was zero: 50 years later it was 40 per cent. This would affect the multiple that people would pay for companies’ earnings.
Volatility has been stoked by changing accounting standards, and by the practice of paying managers with stock options. This gives them an incentive to “throw out the kitchen sink” in quarters when earnings are bad, and overstate losses, so that subsequent profits will look all the better. A chunk of those losses came from a handful of financial groups – but they had all enjoyed overinflated profits for several years leading up to the crisis.
Look at the 10-year rolling average of real earnings and the volatility is put into context. The latest earnings dip no longer looks exceptional, or even very unusual – although it is the worst since the second world war. The bounce is also not unusual. Metrics based on one-year earnings during much of this period would have been useless: Cape makes far more sense.
It cannot be used well for timing, as once bubbles have become established they can reach levels of true insanity (as in 2000) before bursting. If interest rates are low and companies are disgorging cash at a record rate, as at present, stocks can stay expensive for a long time.
But still, why is Cape stubbornly saying stocks are expensive, when the p/e compared with last year’s earnings is below average?
Prof Shiller’s reply: “It diverges so much because earnings have shot up. The sense is that they are unsustainable. They grew at about 2 per cent per year over the last 150 years. When they suddenly shoot up, in the middle of a financial crisis, you wonder.”
He also defends Cape’s simplicity. “It does rely on earnings which are accountants’ efforts to summarise the data,” he admits, but many problems should average themselves out over 10 years. And while 10 years is an arbitrary measure, so is a one-year period. Investors are more likely to pay attention to a measure if it is simple and makes intuitive sense, like Cape.
The more criticisms are aimed at it, the more the waters are muddied. Is it perfect? No measure is, or can be. But it still appears to be better than anything else available. It would be wise to heed the signal it sends, inconvenient though that might be.

