Clash of the Cape crusaders: The world’s leading market historians are locked in an intense debate over the true value of stocks
September 3, 2013 Leave a comment
September 2, 2013 7:57 pm
Clash of the Cape crusaders
By John Authers
The world’s leading market historians are locked in an intense debate over the true value of stocks
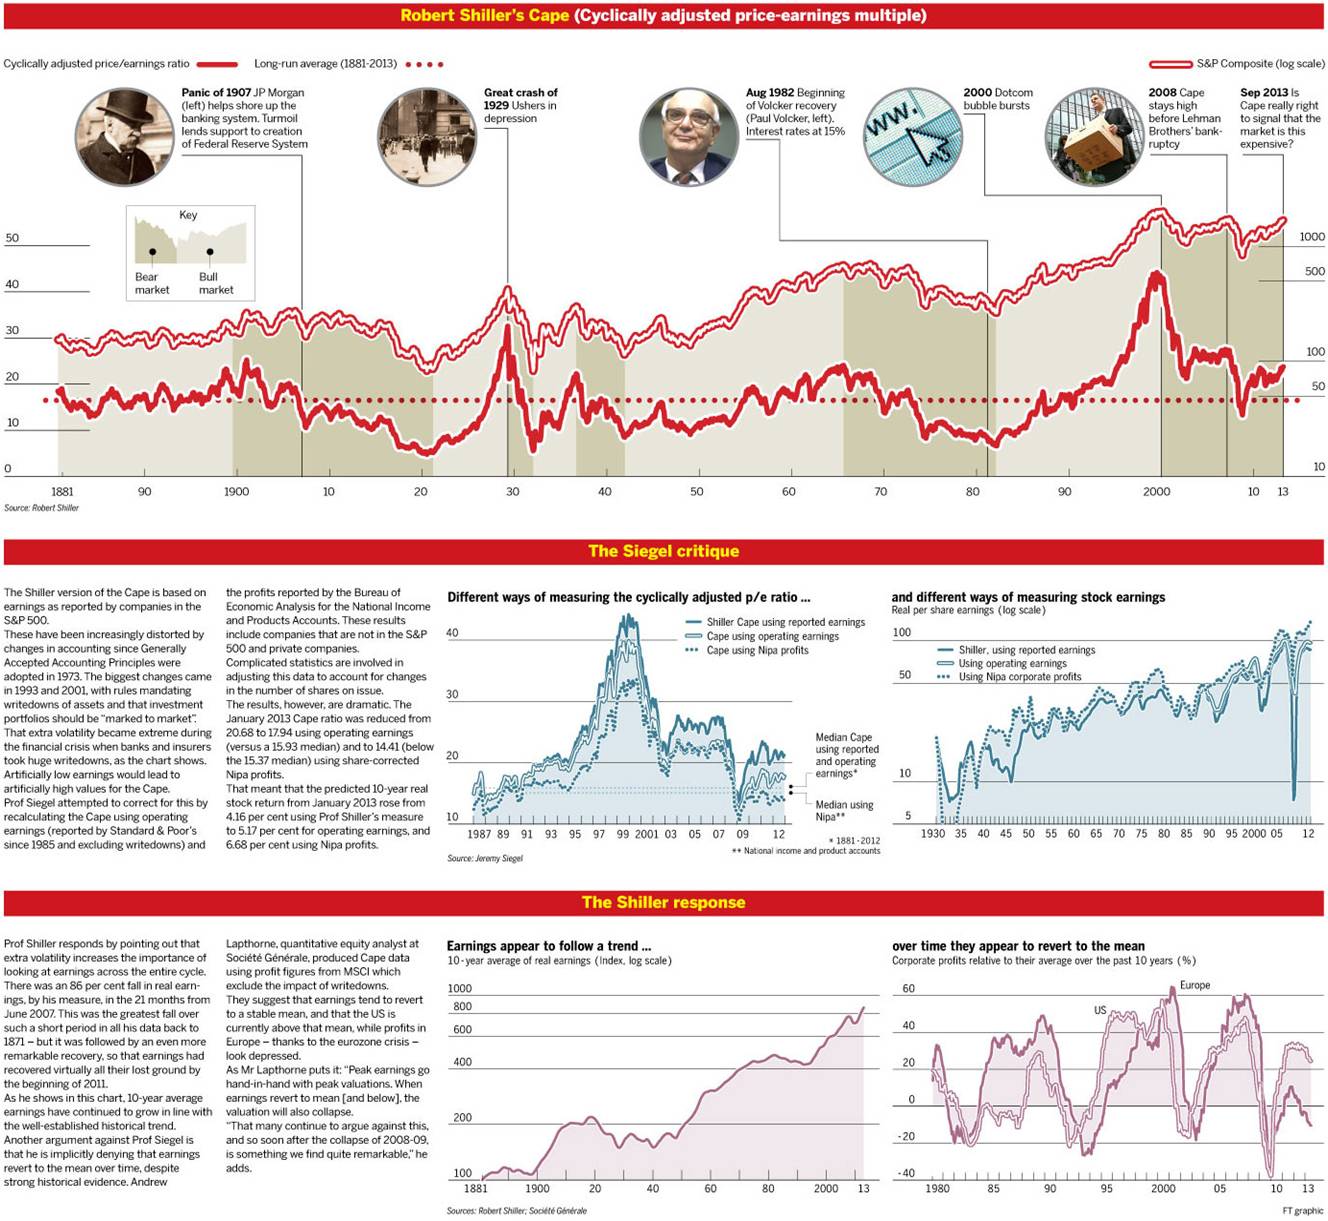
Robert Shiller’s warnings about the internet stock bubble of the late 1990s, followed after a few years by a controversial – and accurate – prediction on the US housing market, earned him the respect of Wall Street and a place on the bestseller list. The Yale economist’s call on the internet boom, articulated in his book Irrational Exuberance, was based on the measure he developed called the Cape, for cyclically adjusted price/earnings multiple. The Cape, which uses earnings data going back to 1871, has gained wide acceptance as an accurate gauge of the market. Prof Shiller and the Cape are sounding the alarm once again, implying that the US market is 62 per cent overvalued and more expensive than any other big stock market.
But the Cape is under attack from another renowned economist, Jeremy Siegel, who contends that it is based on faulty data. Many on Wall Street and the City have doubts too.
Prof Siegel of the University of Pennsylvania’s Wharton School has produced a new version of the Cape, which he says corrects Prof Shiller’s mistakes. And his version suggests that the US stock market is sending a different signal: equities are cheap.
This would be little more than an academic argument – albeit one between the two most famous stock market historians of their generation – if it were not happening at such a gut-check moment in the equity markets. Both men have enthusiastic backers: Prof Shiller is defended by market bears while Prof Siegel has been embraced by the bulls.
Like Prof Shiller, Prof Siegel has made a profound contribution to stock market history and is renowned for his 1994 book Stocks for the Long Run, based on data since 1802. He argues that stocks have returned a consistent average of about 6.5 per cent per year after inflation. This suggests that people should “buy and hold” the stock market, while Prof Shiller’s approach, attempting to pinpoint when the market is overvalued or undervalued, argues for entering and then leaving.
Traders complain that, except for the worst few days of the market crash in March 2009, when the Cape fell briefly below its long-term average, Prof Shiller’s indicator has shown that US stocks have been overvalued for 22 years. Yet the benchmark S&P 500 has more than doubled since March 2009. It also doubled between 2003 and 2007.
“Emotions and heightened attention to the market create a desire to get into the game,” warned Robert Shiller in 1999. “Such is irrational exuberance today in the United States.”
He has devoted his career to analysing how behavioural psychology drives markets occasionally to fail.
He defends the Cape because “I’m a behavioural finance type and I understand that people make all kinds of investing errors”.
He invests in exchange traded funds based on the principle of fundamental indexing championed by Prof Siegel. But unlike Prof Siegel, his work suggests that sometimes people should stay out of the stock market.
In a note last month, Savita Subramanian, head of US equity and quantitative strategy at Bank of America Merrill Lynch, said 15 other measures showed the US market to be either cheap or at fair value. She complained: “The most recent profits recession was the worst we have seen and was exacerbated by a high leverage ratio which has since been dramatically reduced. Assuming that this scenario is going to repeat itself is, we think, overly pessimistic.”
The Cape’s defenders say casting doubt on metrics is a classic symptom of bubbles. Analysts began talking about “price to eyeballs” multiples for internet stocks in 1999 and price-to-cash flow multiples for Japan in 1989.
The central intuition behind the Cape is simple. Taking a multiple of one year’s earnings is misleading because stock markets naturally adjust when traders believe profits are cyclically high or cyclically low.
Compare prices instead to the average of earnings over 10 years (Prof Shiller also corrects for inflation) and it becomes clearer whether stock markets are overvalued or undervalued.
As the chart shows, extremes in the Cape have coincided with favourable times to buy and sell. By staying far above its long-term average during the rebound that followed the internet bust from 2003 to 2007, the Cape also provided a warning that the rally was not to be trusted – ahead of the far worse crisis of 2007-09.
Prof Siegel calls the Cape “the single best forecaster of long-term future stock returns”. But he says that the data on which it is based are now unreliable, sending out a false signal that stocks are expensive.
Jeremy Siegel
Jeremy Siegel is the high priest of “buy-and-hold” investing and argues the merits of stocks over other asset classes. “Through time the after-inflation returns on a well-diversified portfolio of common stocks have not only exceeded that of fixed income assets but have actually done so with less risk,” he has argued. “Which stocks you own is secondary to whether you own stocks.”
Other academics acknowledge the importance of his data but carp that his optimism about stocks has led to some embarrassments. In early 2007, on the eve of the financial crisis, he argued that stock prices should be
25 per cent higher.
Once he had adjusted for writedowns – which were extreme for financial companies in 2008 and 2009 as they accounted for losses during the financial crisis – he found that US stocks were undervalued. He also found that the trend of US earnings growth had increased since the second world war because companies have paid out less of their earnings in dividends, allowing growth in declared profits to rise.
If earnings growth has risen, says Prof Siegel, “this will raise the equilibrium Cape ratio and bias the forecast of future returns downward based on projections made from data where the growth of per share earnings is lower”.
Prof Shiller sounds relaxed about the criticism. The Cape sticks out, he says, “because earnings have shot up. The sense is that they are unsustainable. They grew at about 2 per cent per year over the last 150 years. When they suddenly shoot up, in the middle of a financial crisis, you wonder.”
Others question whether the Cape is of any use for timing market entries and exits. Even when it is far above its long-term average, as in 1996, it can still move far higher above its average before crashing.
This year Elroy Dimson, Paul Marsh and Mike Staunton at London Business School measured the results investors would have achieved had they used the Cape – but only the data then available to them, known as “out of sample” data – to time entries and exits from the market. They found that in all markets “our out-of-sample forecasting model fails to achieve the returns available from remaining in equities all the time”.
They conclude that there is no consistent relationship between forecasts and outcomes. “Sadly, we learn far less from valuation ratios about how to make profits in the future than about how we might have profited in the past.”
But Andrew Smithers, founder of Smithers & Co and an enthusiastic proponent of the Cape, points out that Prof Siegel’s most famous research showed stock prices follow a trend, which means they revert to a mean. “Mean reversion of returns is most simply explained by the mean reversion of equities around fair value,” he says. “The ability to value markets undermines the case for always being invested”.

