How Frothy Is the Nasdaq? The Nasdaq Index is Up 39% in Less Than a year. Are Things Heating Up Too Fast?
November 2, 2013 Leave a comment
How Frothy Is the Nasdaq?
The Nasdaq Index is Up 39% in Less Than a year. Are Things Heating Up Too Fast?
LIAM PLEVEN
Updated Nov. 1, 2013 9:57 p.m. ET
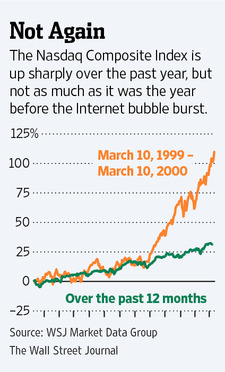
When it comes to the Nasdaq NDAQ -0.38% rally, this time really is different. The Nasdaq Composite Index is up 38% since last November. The jump—and the buzz around technology stocks, many of which are listed on the Nasdaq Stock Market—could remind investors of the late 1990s, just before the Internet bubble burst. The concern is understandable. The Nasdaq index hit an all-time high in March 2000, but fell 51% from that peak by the end of that year. Companies in the index lost $2.67 trillion in stock-market value in the last nine months of 2000, according to data from the World Federation of Exchanges.
But there are important differences surrounding the index’s components between then and now, experts say. The past can provide a useful lesson about the risk of chasing hot stocks, but jittery investors also should be alert to what has changed.
The stocks that make up the Nasdaq are currently less expensive as a group than Nasdaq-listed stocks were before the bubble burst. Shares in the index now trade at an aggregate price/earnings ratio of roughly 19 times per-share earnings in the previous 12 months, based on data through September, compared with 49 in early 2000, according to Ned Davis Research, a research firm in Venice, Fla.
Lower Multiples
Some individual firms in the Nasdaq currently trade at a higher multiple of earnings than the aggregate figure, but the index’s largest companies as measured by market value are cheaper as a group than they were in 1999.
The Nasdaq index is “not as expensive relative to history, and there are more fundamentals supporting it,” says Amy Lubas, technology and industrials strategist at Ned Davis.
At the end of 1999, the 10 largest companies in the index were worth a combined $2.16 trillion and had logged earnings of $26.4 billion over the prior 12 months, according to data Ms. Lubas cited from S&P Capital IQ. Now the top 10 are worth only $1.83 trillion, yet have earned more than four times as much, or $107.6 billion.
“We’re not at all concerned about a quote-unquote tech bubble,” says Richard Wright, portfolio manager at Fiduciary Financial Services of the Southwest, an investment advisory firm in Dallas that has about $360 million in assets and holds shares in a Nasdaq-focused exchange-traded fund in client accounts. He says the firm is neither adding to nor reducing the position significantly.
Companies in the Nasdaq index often are sharing more of their cash hoards with shareholders than they had in the past. Microsoft MSFT +0.34% paid its first dividend in 2003, and in September announced plans to increase its quarterly dividend by 22%. Cisco Systems CSCO +0.02% paid its first dividend in 2011; it raised the dividend most recently in April. Both firms are among the largest in the Nasdaq, as they were back then.
At the same time, there are fewer initial public offerings launching on the Nasdaq exchange, and they aren’t rocketing up as fast. Rapid rises were common in the late 1990s and helped stir the market frenzy.
Through Oct. 31, 95 companies did IPOs on the Nasdaq exchange this year, down from 374 through the same date in 1999, according to Dealogic. In 1999, those stocks rose 97% on average in the first month of trading. This year’s average first-month gains are 27%.
Before the bubble burst, many tech companies had “immature business models,” says Gavin Baker, manager of the Fidelity OTC Portfolio, which tries to beat the Nasdaq index. The fund charges annual fees of 0.76%, or $76 on a $10,000 investment, and has $9.8 billion in assets, according to Fidelity.
Speedboats and Carriers
Mr. Baker describes the difference in boating terms. Back then, “there was an immense number of speedboats and cigarette boats,” he says. “Now, you have aircraft carriers.”
Despite its recent rise, the Nasdaq remains 22% below its peak and hasn’t climbed as sharply as it did in the year before it hit its peak, when it shot up 110%. The index also is climbing at a time when the U.S. stock market is up broadly. In contrast, the Dow Jones Industrial Average fell in early 2000.
Of course, investors who put too much stock in the faith that “this time is different” were among those who got burned when the bubble burst.
Some investing truths endure. One of them is that stocks can slide as easily as they rise. Ask investors who bought shares in Apple, AAPL -0.51% another Nasdaq component, last year at the all-time high of $702.10. The stock price is down 26% since then.
The Nasdaq index remains exposed to any broad shift in sentiment about tech. The sector has been the largest contributor to the index’s performance in 2013 and for three of the four prior years, according to ISI Group, a research firm in New York.
The market capitalization of the index isn’t as highly concentrated in a relative handful of companies as it was in 1999 and 2000. But less than 15% of the index’s components still represent 85% of the value, according to ISI.
“The valuations are not as stretched,” says Pankaj Patel, head of quantitative research at ISI. But that could become a greater concern, he adds, “if the market goes up from here, and the earnings do not keep pace.”

