A Return to Internet Mania? Some Market Observers Fear That We’re in a Bubble Reminiscent of the One We Saw in the Dot-Com Era
November 16, 2013 Leave a comment
A Return to Internet Mania?
Some Market Observers Fear That We’re in a Bubble Reminiscent of the One We Saw in the Dot-Com Era
MARK HULBERT
Nov. 15, 2013 6:10 p.m. ET
We aren’t heading for the next Internet bubble—at least not yet. At a time when the 23-year-old CEO of Snapchat, a two-year-old company with no revenue, turns down a nearly $3 billion buyout offer from Facebook, FB +0.04% and whenTwitter makes a spectacular debut, many people are reminded of the heady days of Internet stocks in the late 1990s and early 2000. Yet the analogy is misleading, according to the leading academic studies of investor sentiment.The authors of those studies are finance professors Jeffrey Wurgler of New York University’s Stern School of Business and Malcolm Baker of Harvard Business School.
One implication of their research is that it is important not to rely on our memories when comparing different periods’ sentiment levels. Not only are our memories short, we also tend to rewrite history to make the past appear different than it really was.
If you are basing your investment strategy on swings in investors’ mood between bearish and bullish extremes, it pays to rely on objective measures and a long-term perspective.
Messrs. Wurgler and Baker developed five indicators that were well correlated with periods of speculative excess over the past 50 years. None of them currently is detecting the levels of exuberance that prevailed at the top of the Internet bubble. They include the following:
The number of IPOs. Two of those five measures relate directly to the new-issues market. The first is the number of recent initial public offerings. Over the first three months of 2000, according to data from University of Florida finance professor Jay Ritter, there were 123 IPOs. By contrast, there were just 73 IPOs in the three months through Nov. 14.
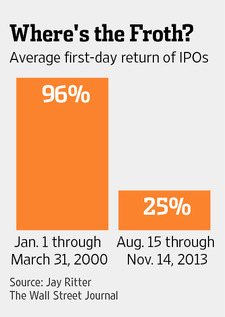
IPO returns. The average first-day IPO pops are also lower now. In the first three months of 2000, the average first-day return was 96%; now, it’s 25%, per Mr. Ritter’s data.
Both IPO numbers are far short of what was seen at the top of the Internet bubble.
The dividend premium. An even bigger contrast in sentiment between today and early 2000 appears in what Mr. Wurgler refers to as the “dividend premium,” or how much investors are willing to pay for the relative safety of established, as opposed to speculative, stocks. That is a useful indicator, he says, because investors become relatively bored with established companies during periods of speculative excess.
To calculate this dividend premium, he categorizes dividend-paying stocks as “established” and those that don’t pay a dividend as “speculative.” To compare valuations, he focuses on the price/book ratio, which is calculated by dividing a stock’s price by its per-share book value, or net worth. Higher ratios indicate richer valuations.
Of course, not all dividend-paying companies are safe, and not all nonpayers are speculative. Nevertheless, Mr. Wurgler says that, historically, the difference in the two groups’ valuations has been a good barometer of investor sentiment.
At the top of the Internet bubble in early 2000, according to Messrs. Wurgler and Baker’s research, speculative companies had a 43% higher price/book ratio than established firms, on average. Today, it is just the reverse: Among the companies in the S&P 1500 index, according to FactSet, established stocks have a 49% higher price/book ratio than nonpayers, on average.
Share of new corporate cash from issuing stocks. The fourth sentiment indicator focuses on the percentage of new corporate cash coming from stock issuance rather than from longer-term debt that matures in more than one year.
Mr. Wurgler says this indicator is a good measure of sentiment because companies increasingly turn to the stock market to raise money as the market becomes more speculative.
Over the first three months of 2000, at the very top of the Internet bubble, this equity percentage stood at 20%. Today, it stands at 11%—or just over half as high. The low percentage of corporate financing coming from stock issuance hardly points to a speculative market. (One might wonder if this overwhelming preference for long-term-debt financing points to a bubble in the debt market, but that possibility isn’t one that Messrs. Wurgler and Baker have studied.)
Share turnover. The last of the five sentiment indicators is based on how often the average share listed on the New York Stock Exchange is sold—the so-called turnover rate—which the professors found increases along with speculation.
Over the first three months of 2000, turnover was running at an annual rate of 89%. Today, according to New York Stock Exchange data, the comparable rate is 60%.
What’s more, Mr. Wurgler says, recent turnover is, if anything, skewed upward by factors that weren’t present in early 2000, such as high-frequency trading. And yet this indicator appears to be showing a lower appetite for speculation than at the top of the Internet bubble.
The investment implication of all five sentiment indicators: If you were thinking of reducing your stock holdings out of a concern that a bubble was forming, you can instead continue to give the bull market the benefit of the doubt.
The best advice for individual investors would then be to invest in a broad-based index fund, such as the Vanguard Total Stock Market VTI +0.44% exchange-traded fund. It is the one recommended by David Nadig, president of ETF Analytics at research firm IndexUniverse, which publishes the Journal of Indexes.
Mr. Nadig says his recommendation is based on a number of factors, including expenses, liquidity and how closely the fund tracks the overall market. Its annual expense ratio is 0.05%, or $5 per $10,000 invested.
If you want to avoid the more-speculative sectors of the market, you could shift your stock holdings toward so-called large-cap value stocks, which represent more established companies trading for relatively low price/book ratios. Mr. Nadig’s firm recommends theGuggenheim S&P 500 Pure Value RPV +0.25% ETF, which charges fees of 0.35%.
To be sure, a market decline could still happen at any time, even if the current investor mood isn’t comparable with what prevailed in early 2000. If being invested in the stock market through a decline would translate into intolerably large losses, then you should reduce the amount you have invested in stocks to whatever level you would be comfortable holding through such a decline.

