Index ETFs May Not Track Benchmarks as Expected; The Basic Idea: Their Returns Trail by the Amount of Fund Expenses. But That Isn’t the Whole Story
June 6, 2014 Leave a comment
Index ETFs May Not Track Benchmarks as Expected
The Basic Idea: Their Returns Trail by the Amount of Fund Expenses. But That Isn’t the Whole Story.
ARI I. WEINBERG
Updated June 2, 2014 5:21 p.m. ET
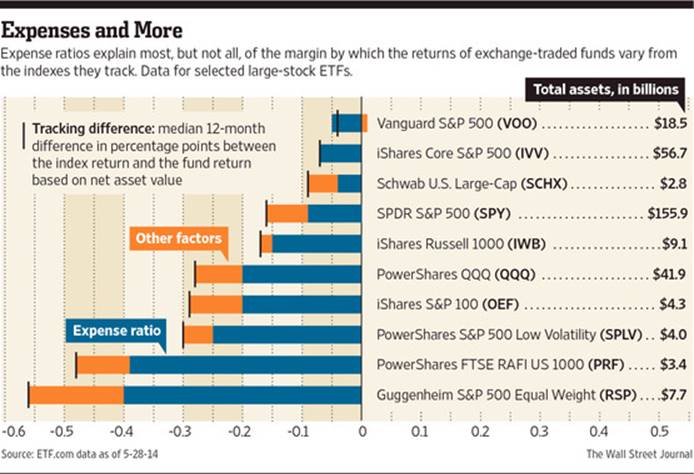
The party line on index exchange-traded funds is that they offer easy exposure to a benchmark, less the fund’s expense ratio. If a stock index were to gain 10% this year, for instance, and an index ETF charges 0.1% of fund assets a year in expenses, an investor in that ETF might expect to earn 9.9%.
The reality is messier. The fund’s costs to buy and sell securities, and other aspects of portfolio management, influence your return as well.
For most stock ETFs, this slippage beyond the expense ratio is usually marginal: The median added cost is four-hundredths of a percentage point for ETFs with more than $100 million in assets that invest in U.S. stocks, according to data from research firm ETF.com. Some ETFs even overcome some costs to deliver tighter index-hugging than their expense ratios would indicate.
In other cases, the lag in ETF performance is significantly greater than one might expect based on fund expenses alone.
Follow the Benchmark
The easiest way to find the hidden costs (or added value) is to look at an ETF’s returns relative to its benchmark. ETF.comcomputes a statistic known as “median tracking difference,” the median discrepancy over 12-month periods between the fund’s return based on net asset value (rather than share price) and the return of the index.
The tracking-difference statistic can be found at ETF.com under the “Efficiency” tab for most ETFs. Other data providers and the ETF issuers themselves also provide some indication of a fund’s differential from its benchmark, often by showing the benchmark return and the fund’s return over several time periods.
After brokerage costs, a key factor that affects index tracking is whether a fund holds all of the securities in its benchmark or practices “optimization,” meaning it holds only a sampling of index components that it expects to perform similarly to the overall benchmark over time. Managers tend to optimize primarily due to limited trading or scarcity of stocks in an index. Higher trading costs and particularly challenging optimization are common among the new breed of so-called smart-beta strategies that require more frequent trading and portfolios that are more difficult to manage.
William Belden, managing director of product development at Guggenheim Investments, says the additional 0.16 percentage-point tracking difference attributable to trading costs and other factors for the Guggenheim S&P 500 Equal Weight ETF RSP +0.17% is “a minimal gap when considering the fund’s performance history.”
Another way that index-fund managers try to add value and narrow tracking difference is through securities lending. This involves an ETF making a certain part of its portfolio available for other investors, often short sellers, to borrow for a fee. Harder-to-borrow stocks earn the ETF a bigger payment.
“Securities lending adds a little extra income to the fund, goosing performance,” says Dave Nadig, chief investment officer for ETF.com.
Over the past year, index ETFs with tracking differences significantly better than the expense ratio included small-stock funds and sector funds in biotech, energy and transportation. For the six months ended Sept. 30, the $1 billion WisdomTree SmallCap Dividend DES -0.41% —which can hold nearly 1,400 stocks—earned $515,000 in securities-lending income, compared with the similarly sizedWisdomTree LargeCap Dividend, DLN +0.04% holding one-fifth of the stocks, but earning just $8,808 from securities lending.
Securities-lending income can be highly volatile and influenced by the ETF holding hot stocks, often with a small float or driven by momentum investors. In biotech, which soared in recent years but recently tumbled, the SPDR S&P Biotech XBI -1.25% ETF has an expense ratio of 0.35%, but the ETF.com tracking-difference figure shows the fund beating its benchmark by a median 0.25 percentage points over 12-month periods.
There’s another wrinkle for some of the earliest ETFs, including SPDR S&P 500SPY +0.11% and PowerShares QQQ. QQQ -0.10% They are structured as unit investment trusts—a cousin of conventional mutual funds that can’t lend stocks or reinvest dividends. This causes a “cash drag” in up markets and a buffer on the way down and helps explain some of the difference in tracking between the SPDR S&P 500 and competing Vanguard and iShares funds tracking the same index.
More to the Picture
Investors should note that the expense ratio and other aspects of tracking difference are only part of ETF costs. There may also be brokerage commissions to buy and sell ETF shares, and trading spreads. Also, ETF shares can trade at a premium or discount to net asset value.
Moreover, the type of exposure you want, not costs, should be the starting point in selecting a fund. “When shopping for an index ETF, investors should look at asset class, market cap, weighting methodology as well as management fee,” says Chris Hempstead, head of sales at brokerage firm KCG Holdings Inc.
That a fund’s operations—optimization and securities lending—can, in some cases, aid it in overcoming its expenses is simply a sign of a portfolio manager doing the right things.

